
Quick Answer
Bitcoin is sitting on its 200-week moving average, around $61,300. That line is the average of almost four years of weekly prices, and it marked or framed the bottom of every previous bear market: 2015, 2018, the 2020 crash, and (with a messy overshoot) 2022. Right now it's being touched for the first time this cycle, while more than half of all Bitcoin sits at a loss and momentum readings hit multi-year extremes. It's the deepest Paddle Zone in the ocean. But this is also the line's first stress test in the ETF era, and respected analysts still see October 2026 as the more likely bottom. Historic value zone? Yes. Guaranteed floor? No.
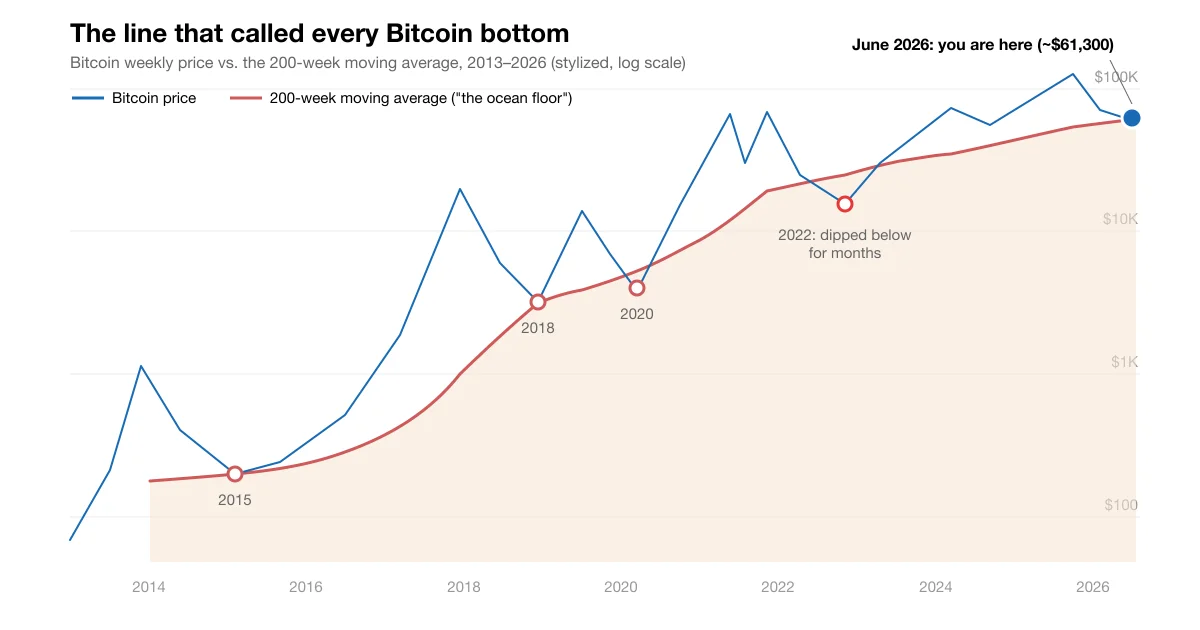 Chart: WaveTrader illustration (stylized, not to scale)
Every crypto site you open this month is shouting about the same chart. One blue line, one red line, and a market holding its breath where they meet. The red line is Bitcoin's 200-week moving average, and it has one of the most remarkable track records in all of crypto: in every previous bear market, this is the level where the falling stopped. Now Bitcoin is touching it again, at roughly $61,300, for the first time this cycle. If you're new here and a little scared, this article is for you. No trader jargon, no three-monitor setup required. Just a clear read of the deepest water in the ocean.
🔑 Key Takeaways
- The 200-week moving average is the slow swell under the chop: it averages almost four years of weekly closes, so daily panic barely moves it. It sits near $61,300 today.
- Its track record is real: the 2015, 2018, and 2020 bottoms all formed right on this line. In 2022, price dipped below it for about seven months before recovering, so it's a zone, not a force field.
- A rare confluence is flashing: over half of Bitcoin's supply is underwater (a classic bottom marker), long-term momentum is at multi-year lows, top buyers are capitulating, and miners are under pressure, all at once.
- The honest caveat: this is the line's first test in the ETF era, and analysts like Benjamin Cowen still point to October 2026 as the base case for the final bottom.
- If the line breaks, there's a deeper floor: the 300-week average near $54,000, which tracks the average cost basis of all Bitcoin in existence.
What Is a Moving Average, in Plain Language?
Watch the ocean for one minute and you'll see chaos. Splashes, chop, foam, little waves crossing each other. Watch it for an hour and something else appears: the swell, the big slow rhythm underneath all that noise. Price charts work exactly the same way.
A moving average is just a running average of past prices. Take the last 200 weekly closing prices of Bitcoin, add them up, divide by 200, and you get one point. Do that again every week and connect the dots. That's it. No magic, no secret formula.
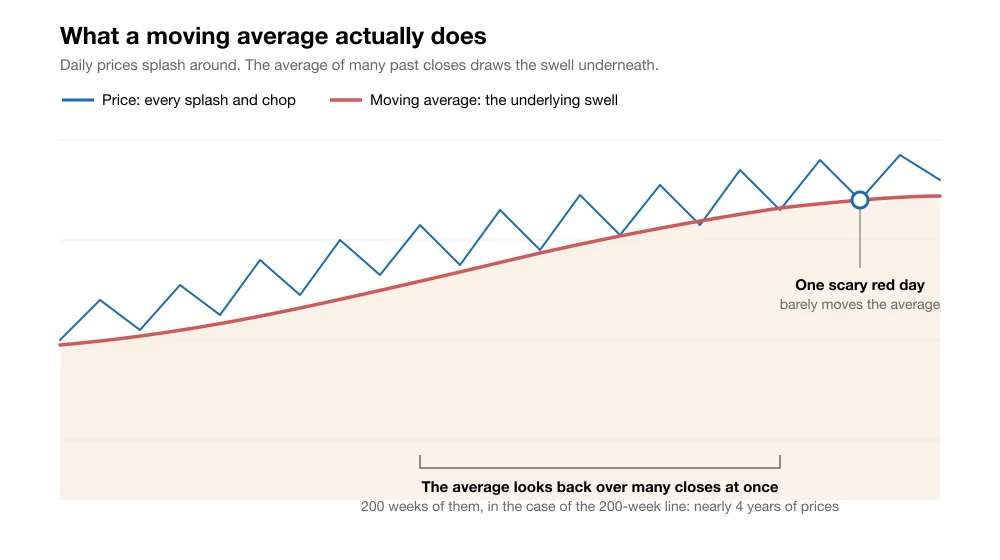 Chart: WaveTrader illustration
Because the 200-week version averages almost four years of prices, it moves incredibly slowly. One terrifying red week? It barely flinches. A whole terrible quarter? It shrugs. The line only reflects what the market has done over an entire cycle, which is why traders treat it as the deepest measure of Bitcoin's long-term trend. If you want a gentle intro to indicators like this one, our guide to visual trading analytics covers the basics with the same beach-brain approach.
200-Week Moving Average (200W MA)
The average of Bitcoin's last 200 weekly closing prices, covering almost four years. It filters out all the surface chop and draws the deep swell of the market. Think of it as the ocean floor: the Wipeout Zones above it mark where individual waves crash, but this line marks where the water itself ends.
Why the 200-Week Line Is the Deepest Paddle Zone in the Ocean
Here's the part that makes this line famous. Pull up Bitcoin's entire history and mark every time price fell all the way down to the 200-week moving average. It's a short list, and it reads like a tour of the scariest moments in crypto:
January 2015, around $200:
After an 85% collapse from the 2013 peak, Bitcoin found the line and stopped falling. That touch was the bottom. The next wave carried it to nearly $20,000.
December 2018, around $3,200:
The brutal end of the 2018 bear market landed almost exactly on the line. Again, that was the low. The recovery that followed tripled the price within six months.
March 2020, the COVID crash:
In the fastest panic in modern market history, Bitcoin wicked briefly through the line and snapped right back above it. Within a year it had printed a new all-time high.
2022, the exception that keeps everyone honest:
After the Luna and FTX collapses, Bitcoin broke below the line and spent roughly seven months underneath it before recovering in 2023. The line still framed the bottom zone, but it did not hold on first touch. Remember this one. It matters for today.
In WaveTrader language: Wipeout Zones mark where individual waves crash. The 200-week line marks where the ocean floor is. It's the deepest Paddle Zone on the whole chart, the level where, historically, the biggest waves of the next cycle started forming while everyone else was still too scared to paddle out. That's also why so much long-term buying interest concentrates here: everyone who studies Bitcoin history knows this level, which partly makes the support self-fulfilling.
June 2026: The Touch (and the Wobble Below)
So where are we now? Bitcoin topped at $126,080 in October 2025 and has spent 2026 grinding down through one correction after another, including the four-headed June wipeout we covered last month. By early June, the price finally reached the line everyone had been watching: the 200-week moving average, sitting around $61,300.
It wasn't a clean touch. On the first Friday of June, a much hotter than expected U.S. jobs report (172,000 new jobs versus roughly 85,000 forecast) crushed hopes of rate cuts, and Bitcoin slipped below the line to about $60,800 for the first time since 2022. Then it climbed back. Since then, price has been hugging the line, closing last week at $61,749, unable so far to break back above the $64,000 to $65,000 resistance shelf overhead.
That's the whole drama in one sentence: Bitcoin is lying on the ocean floor, and the market is waiting to see whether the floor is solid.
🏄 Pro Surfer Tip
Long-term levels like this one are about weekly closes, not intraday wicks. A few hours below the line means very little. What the old-timers watch is where the candle closes on Sunday night, week after week. One brief dip below in 2020 meant nothing; seven months of closes below in 2022 meant a longer flat spell.
Four More Bottom Signals Flashing at Once
A single indicator touching a single line wouldn't be worth this much ink. What makes summer 2026 unusual is the confluence: several independent bear market bottom signals firing in the same window. Here's each one, in beginner terms.
1. More than half of all Bitcoin is underwater
Glassnode data in early June showed about 51.7% of all circulating Bitcoin sitting at an unrealized loss, meaning it was bought at higher prices than today's. That crossover, where more coins are losing than winning, sounds grim. Historically it's the opposite: this exact flip appeared near the bottoms of 2015, 2019, and 2022. When the majority of the market is underwater, most of the people who were going to panic-sell already have.
2. The top buyers are finally capitulating
Analysts at Compass Point flagged that roughly 26% of Bitcoin sold in the past 30 days came from people who bought near the cycle top. That cohort had held on stubbornly through the whole decline and is now giving up as prices approach new cycle lows. Capitulation is painful to watch, but bottoms are made when the last stubborn holders finally sell, not when everyone is still hopeful. We covered the emotional side of this in our guide to market cycle psychology.
3. Long-term momentum is at multi-year extremes
RSI, or Relative Strength Index, is a gauge of how stretched a move has become. On the monthly chart, the slowest and most zoomed-out version, analysts tracking long-term momentum note readings near the second-lowest level in 17 years. Zoomed-out momentum this washed out has historically appeared only deep in bear markets, close to where they ended. The famous Rainbow Chart tells the same story: price has dropped into its deep-blue "fire sale" band, touched only once before in recent memory, during the FTX collapse in November 2022.
4. Miners are under maximum pressure
Miners are the industrial base of Bitcoin, and their electricity bills don't fall when the price does. At these levels, less efficient miners shut down rigs and some are forced to sell their reserves, a pattern known as miner capitulation. It's another classic late-bear signal: the network's own producers throwing in the towel has historically clustered near cycle lows, not near the middle of declines.
Add the record 13-day ETF outflow streak from early June (about $4 billion leaving U.S. spot Bitcoin ETFs) and you get the full picture: nearly every gauge of fear and exhaustion that marked previous bottoms is flashing at once, right as price sits on the most-watched support line in crypto.
Hold or Break: Kai Reads the Two Scenarios
From here, the chart really only has two paths, and it's worth knowing what each would look like before it happens. We asked Kai, our AI surf analyst, to narrate them the way a lifeguard would.
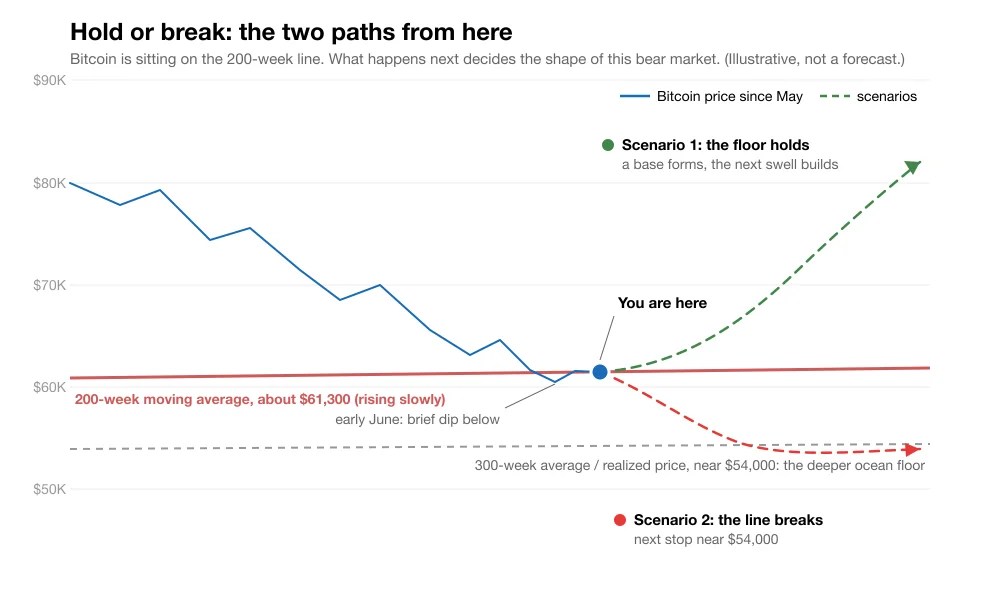 Chart: WaveTrader illustration (stylized, not to scale)
"Scenario one, the floor holds. Price stops making new lows, weekly candles keep closing above the line, and the $64K to $65K shelf overhead eventually breaks. That's how 2015 and 2018 ended: quietly, with no bell ringing. The deepest Paddle Zone becomes the launch ramp, and the biggest waves of the next cycle start forming while the beach is still empty."
"Scenario two, the line breaks. Weekly closes start printing below $61K and stay there, like August 2022. Then the next floor is the 300-week average near $54,000, which sits right on top of realized price, the average cost of every Bitcoin ever moved. A break isn't the end of the ocean. It's a longer flat spell, and 2022 proved you can spend months below this line and still recover to new highs. But it would push the recovery timeline out, not cancel it."
If you want to watch this play out on your own screen, the WaveTrader app draws these levels as Paddle Zones and Wipeout Zones directly on the chart, so you can see at a glance whether Bitcoin is holding the floor or slipping through it, without squinting at raw numbers.
The Honest Caveat: First Stress Test of the ETF Era
Now for the part most viral posts skip. Two serious reasons to keep your excitement on a leash.
First, every previous touch of the 200-week line happened in a market structure that no longer exists. There were no U.S. spot Bitcoin ETFs in 2015, 2018, 2020, or 2022. Today, ETFs hold enormous amounts of Bitcoin on behalf of investors who can sell with one click in a brokerage account, and those same products just bled roughly $4 billion in a record 13-day streak. Nobody knows how this line behaves when institutional flows dominate, because it has never been tested under these conditions. Michael Saylor frames the current weakness as capital rotating into the AI buildout rather than anything broken in Bitcoin, and he may be right, but that rotation is exactly the kind of force the old playbook never had to absorb.
Second, the calendar. Benjamin Cowen, one of the most-followed cycle analysts in crypto, points out that previous bear markets bottomed roughly a year after the top. The top was October 2025, which makes his base case for the final bottom October 2026, still months away. He also notes Bitcoin is tracking its typical midterm-year path, down about 30% year-to-date versus a historical 32% at this point, so nothing about 2026 looks unusual enough to expect an early bottom. And he's blunt about the line itself:
"About every four years or so, Bitcoin has a date with destiny, and destiny is the 200-week moving average... Unfortunately, last cycle it did not [hold]. We did in fact go below it. I cannot say with a clear conscience that we won't go below it."
So the honest summary is this: the location says "historic value zone," and the calendar says "possibly early." Both can be true. In 2018, the touch of the line and the final bottom were the same event. In 2022, the touch came first and the true bottom arrived months later, a little lower. Anyone who tells you they know which version 2026 will be is selling confidence they don't have.
So Is the Bottom In? What a Beginner Should Actually Do
Here's the good news: you don't need to answer that question to act sensibly. Catching the exact low is a professional's game and mostly a lottery even for them. What history actually rewards near the 200-week line is patience and structure, not heroics.
What tends to work here
Small, scheduled buys over months (dollar-cost averaging), position sizes you can hold through another 20% drop, and watching weekly closes instead of hourly candles.
What tends to hurt here
Going all-in because "the bottom is in," using leverage at a level famous for violent wicks, and panic-selling if the line breaks and the flat spell drags on.
If you're going to paddle out into this zone, do it the way surfers approach big water: gradually, with respect, and with a plan for being wrong. Our bear market survival guide walks through dollar-cost averaging step by step, and it pairs well with everything in this article.
The 200-week wave is the deepest, slowest, most patient wave Bitcoin makes. It called the bottom in 2015. It called it in 2018. It caught the COVID crash in a single weekend. It even framed the messy 2022 low, just with a delay. Now it's being tested again, in a market full of ETFs, AI narratives, and half a nation of underwater holders. Whether it holds on the first touch or after one more scary overshoot, this is the neighborhood where previous cycles quietly began. Keep your leash on, size your board honestly, and read the swell for yourself. That's what this line has always rewarded.
And if you'd rather have the levels drawn for you while you learn, WaveTrader's Live Zones tracker marks the deep Paddle Zones and the Wipeout Zones above them in real time, with Kai on hand to explain what the water is doing. The ocean is big. You don't have to read it alone.