

Quick Answer
No, it isn't altcoin season. On the November 15, 2026 close, 61 of 391 coins WaveTrader tracks had beaten Bitcoin over 30 days, which is 15.6%. Over 90 days it was 120 of 390, or 30.8%. Altcoin season needs 75%. The public altcoin season index agrees, at 33 on BlockchainCenter and 46 on CoinMarketCap.
 Image Source: Cyr~commonswiki, Wikimedia Commons (CC BY-SA 3.0), cropped
Every few weeks somebody posts a chart of one coin that doubled and asks if altcoin season has started. One coin can't answer that. The altcoin season index exists to answer it properly, by counting how many coins are beating Bitcoin instead of pointing at the loudest one. So I ran that count myself, across every coin WaveTrader tracks that I could price cleanly. Below are the two numbers, the coins I left out, and the date I measured, so you can check my work.
🔑 Key Takeaways
- 30 days: 15.6%. 61 of 391 coins beat Bitcoin. Bitcoin itself fell 19.9%, and the typical coin fell 29.3%.
- 90 days: 30.8%. 120 of 390 coins beat Bitcoin, which was up 1.3%. That's well short of the 75% line.
- Size matters. 48% of the 50 largest coins beat Bitcoin over 90 days. Outside the largest 100, only 27% did.
- Beating Bitcoin isn't the same as making money. Over 30 days, only 15 of the 391 coins were up at all.
- The public indexes agree. BlockchainCenter reads 33 and CoinMarketCap reads 46. Neither is close to 75.
What the Altcoin Season Index Measures
The idea is simple. Pick a list of coins. For each one, ask whether it did better than Bitcoin over the last 90 days. The share that says yes is the index.
BlockchainCenter counts the top 50 coins. CoinMarketCap counts the top 100. Both leave out stablecoins and tokens that only mirror another asset, such as wrapped Bitcoin. Both use the same two lines. At 75 or above, it's altcoin season. At 25 or below, it's Bitcoin season. Everything between is neither.
Altcoin Season
A stretch when at least 75% of large coins have beaten Bitcoin over the past 90 days. Picture a lineup of surfers. One of them catching a wave is a good ride. Three out of four catching waves in the same hour means the swell has arrived for everyone.
When I checked this morning, November 16, BlockchainCenter read 33 and CoinMarketCap read 46. CoinMarketCap's reading was 38 a week ago and 60 a month ago, and its high for the past year was 64 on September 26. BlockchainCenter's counter says the last altcoin season by its measure was 416 days ago. It has been a long flat spell.
Those two indexes stop at 50 and 100 coins. Most people hold something smaller than that. I wanted to know what the count looks like when you keep going down the list.
The Number: How Many Coins Are Beating Bitcoin
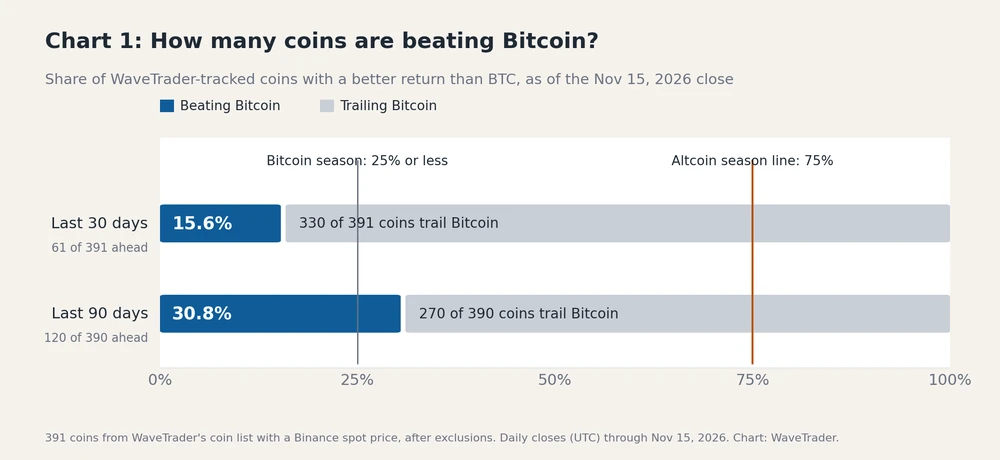 Chart: WaveTrader. Prices: Binance spot daily closes
Here is the count on the November 15, 2026 close.
| Last 30 days | Last 90 days | |
|---|---|---|
| Coins measured | 391 | 390 |
| Coins beating Bitcoin | 61 | 120 |
| Share beating Bitcoin | 15.6% | 30.8% |
| Bitcoin's return | Down 19.9% | Up 1.3% |
| Middle coin's return | Down 29.3% | Down 8.8% |
| Coins up in dollar terms | 15 | 127 |
Start with the 30-day column, because it covers the sell-off. Bitcoin closed near $81,600 on October 16 and at $65,351 on November 15. That's the drop we walked through in the November sell-off in three charts. In that Down Crash, 330 of 391 coins fell further than Bitcoin did. Ethereum lost 24.3%, XRP 25.7% and Solana 30.3%.
People often expect money to rotate from Bitcoin into smaller coins when Bitcoin stumbles. It didn't happen this time. When Bitcoin wiped out, the rest of the lineup went down harder.
The 90-day column is kinder, and it's the one the public indexes use. Bitcoin is roughly flat over that stretch, up 1.3% from about $64,500 in mid-August. Against that low bar, 120 coins finished ahead. Zcash is up 78.2%, NEAR is up 96.3% and Quant is up 176.7%. Those are real rides. They're also three surfers out of 390.
One more number I find useful. Only 34 coins beat Bitcoin on both windows. If you're looking for strength that lasted through the storm, that's the short list, and it's 9% of the water.
Beating Bitcoin
A coin beats Bitcoin when its return is higher than Bitcoin's over the same days. It doesn't have to be positive. BNB fell 17.3% over 30 days while Bitcoin fell 19.9%, so BNB counts as a winner here and its holders still lost money. Read every altcoin season number with that in mind.
The Coin Count, the Exclusions and the Date
A percentage like this depends on what you count, so here is all of it.
The date. Every figure uses the daily close for November 15, 2026, which on Binance is the price at 00:00 UTC on November 16. The 30-day return compares that close with the October 16 close. The 90-day return compares it with the August 17 close. I used the last finished day so that every coin is measured at the same moment.
The starting list. I pulled the active entries from WaveTrader's coin list on November 16. There were 843 after removing three duplicates. That list is a catalog. It includes many coins with no live market, and stablecoins the database had already flagged were gone before I started. The number that matters is how many coins are left after the exclusions.
The prices. Binance spot markets quoted in USDT, daily closes. That's the same price source WaveTrader's wave analysis uses.
The exclusions. 452 entries came out. Each one is counted once, under the first reason in the table that applied to it.
| Left out | Coins | Why |
|---|---|---|
| Bitcoin | 1 | It's the yardstick |
| Stablecoins and currency-pegged tokens | 17 | Built not to move. Includes any token whose price stayed inside a 6% range for 100 days |
| Tokenized stocks and ETFs | 21 | Tokens that follow shares such as Nvidia or Tesla. They aren't crypto assets |
| Wrapped and staked copies | 5 | They mirror ETH or SOL, which are already counted |
| Bitcoin-pegged tokens | 2 | They are Bitcoin in another wrapper |
| Gold-backed tokens | 2 | They follow the gold price |
| No Binance USDT market | 287 | No price from the same source. This group includes LEO, Cronos, Mantle and Kaspa |
| No close on November 15 | 117 | The Binance market was delisted or halted. Monero is the biggest name here |
That leaves 391 coins for the 30-day count. Hyperliquid's Binance market opened on September 24, so it has no price from 90 days ago and the 90-day count has 390.
The weak spot is the 404 coins I couldn't price from Binance. A few of them are large. I chose one price source for every coin over mixing exchanges, because mixed sources close their days at different hours and that can flip a coin that's within a point of Bitcoin. If you hold one of the missing coins, the last section shows how to run the test on it by hand.
Bigger Coins Are Holding Up Better
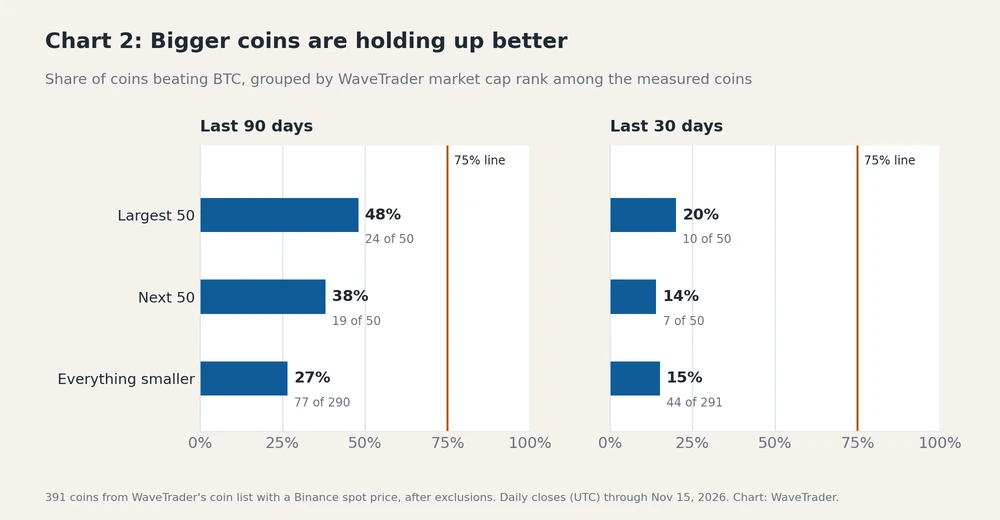 Chart: WaveTrader. Prices: Binance spot daily closes
I sorted the measured coins by their market cap rank in WaveTrader and split them into three groups. Over 90 days, 24 of the 50 largest beat Bitcoin. In the next 50 it was 19. Among the 290 smaller coins it was 77, which is 27%. That last group includes 68 coins with no rank in our list, and they scored about the same as the ranked ones.
That explains why my 30.8% sits below CoinMarketCap's 46. Their index stops at the top 100. My largest 100 come out at 43%, which is close to theirs given that our lists and closing times differ a little. The gap opens up when you add the small coins, because the small coins are where the weakness is.
This matters because most people picture altcoin season as small coins leading. This autumn the strength is near the top of the list, in names like Zcash, NEAR, Uniswap and Avalanche. Some of that probably comes from how institutions buy now, which we covered when we looked at the altcoin ETF wave. Fund money goes to coins that have a fund, and those are large ones. I can't prove that from this data. The size pattern itself is plain in the chart.
Over 30 days the size edge mostly disappears. The largest 50 managed 20% and everything else sat near 15%. A Down Crash that hard pulled almost every board under.
How Far Ahead or Behind Each Coin Is
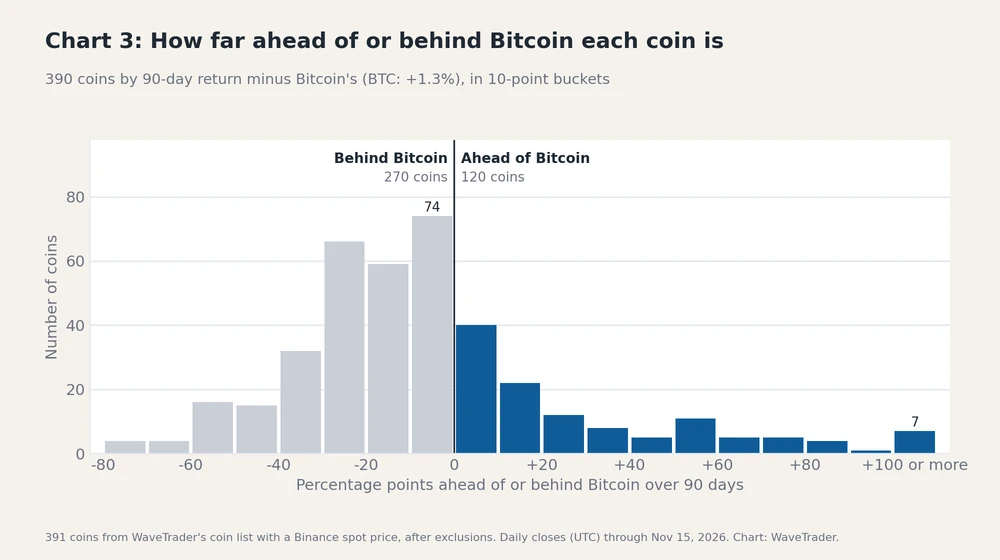 Chart: WaveTrader. Prices: Binance spot daily closes
A single percentage hides the shape, so here is every coin placed by how many points it finished ahead of or behind Bitcoin over 90 days.
Two things stand out. The tallest bar is the one just left of the line. 74 coins trail Bitcoin by less than ten points, and another 40 lead it by less than ten. That's 114 coins, almost a third of the list, close enough that one good or bad week would move them across. The index can swing fast for that reason. CoinMarketCap's reading went from 60 to 38 to 46 inside a month.
The other thing is the right-hand tail. Seven coins beat Bitcoin by more than 100 points. Those are the charts that get screenshotted and passed around, and they're why it can feel like altcoin season when it isn't. The left side has no matching spike, only a wide slope of coins that are 20, 30 or 40 points behind. The damage is spread across many coins and the gains sit in a few.
🏄 Pro Surfer Tip
Before you buy a coin because it "outperformed Bitcoin", check both windows. Only 34 of these coins led on 30 days and on 90 days. A coin that leads on one and trails on the other may have had a single good week.
How to Check It Yourself
You don't need my spreadsheet to answer the question for your own quiver. Here's the same test by hand.
- 1. Pick one window and stick with it. Thirty days tells you about the current move. Ninety days is what the altcoin season index uses.
- 2. Write down Bitcoin's percentage change over that window. Today that's down 19.9% for 30 days and up 1.3% for 90.
- 3. Do the same for each coin you hold, using the same start and end dates and the same exchange.
- 4. Count how many of your coins have the higher number. That's your personal altcoin season score.
- 5. Then look at the dollar return on its own. A coin that beat Bitcoin by falling 17% still cost you 17%.
There's a shortcut for a single coin. Most exchanges list pairs priced in Bitcoin, such as ETH/BTC. If that chart is rising, the coin is beating Bitcoin, and if it's falling, it isn't. You get the answer without a calculator. If chart reading is new to you, our beginner's guide to market analysis covers the basics.
If most of your coins fail the test, that isn't a reason to sell everything tonight. It's a reason to ask why you hold each one. Our guide to building a profitable portfolio has a simple way to decide how much belongs in Bitcoin and how much in everything else.
WaveTrader can save you some of the legwork. Each coin's chart shows whether price is in a Paddle Zone or a Wipeout Zone, and Live Patterns lists the coins whose waves have been running longest. You can also ask Kai, our AI surf analyst, to read the wave state for a coin next to Bitcoin's.
What a Real Altcoin Season Would Look Like
These are the three things I'd need to see in this count before saying the swell has turned.
The 30-day share climbs past the 90-day share.
Right now the short window is the weaker one, 15.6% against 30.8%. That means the lead is fading. When a turn is real, the 30-day number rises first and pulls the 90-day number up behind it.
Small coins catch up with large ones.
The 27% for coins outside the largest 100 is the number to watch. An Up Swell that only lifts the top 50 is a handful of good trades. It becomes a season when the smaller coins join in.
Coins beat Bitcoin while going up.
Fifteen coins in the green over 30 days is not a season of anything. Falling less than Bitcoin counts on the index, but nobody remembers 2021 for that. I'd want to see most of the winners with a positive return.
Until then, the count says Bitcoin is still the board most of the market can't keep up with, and this is after a month in which Bitcoin lost a fifth of its value. Crowds tend to call altcoin season at the top of a rally and forget about it at the bottom. Our piece on market cycle psychology explains why. A number you can recount each month is a better guide than the mood on your feed.
So, is it altcoin season yet? No. Three coins in ten are ahead of Bitcoin over 90 days, one in six over 30, and the line is three in four.
This article is market commentary for education, not financial advice. Figures use Binance spot daily closes for November 15, 2026 and the WaveTrader coin list as of November 16, 2026. Index readings from BlockchainCenter and CoinMarketCap were taken on November 16, 2026 and change daily.