

Quick Answer
Bitcoin fell below $70,000 on November 13, 2026 because a rally failed on November 5, hot inflation data on November 10 raised the odds of a December rate hike, and Nvidia's CEO resigned on November 12. The dollar only started climbing after the inflation report, so it explains the last leg down and not the first. Forced selling came in bursts each time a floor broke, and the $70,000 break took Bitcoin from $70,900 to $67,600 in under four hours.
 Image Source: W.carter, Wikimedia Commons (CC0)
Why is Bitcoin down? If you typed that into a search bar this week, you probably got ten headlines and ten different culprits. The dollar. Nvidia. The Fed. Liquidations. They're all partly right, and that's what makes it confusing. So I pulled the price, the US Dollar Index and the liquidation numbers onto the same dates, from October 20 to this morning. Lined up like that, you can see which wave hit first and which ones only piled on later.
🔑 Key Takeaways
- Selling began on November 5. Bitcoin hit $81,080 on November 4 and gave the whole rally back the next day. The October 29 Binance hack had already weakened the market.
- The dollar was late. The Dollar Index sat flat while Bitcoin lost its first $7,000. It rose 1.7% in the four trading days after the November 10 inflation report.
- Forced selling came in bursts. Reported 24-hour liquidations topped $1.2 billion on four separate days. The highest figure reported, about $1.64 billion, came with the $70,000 break.
- The $70,000 break took under four hours. From 02:00 UTC on November 13, price slid 4.6% to a low near $67,600.
- It's still a higher low than June. This morning's low near $66,400 sits about 9% above the June bottom. The Fed is the bigger worry this time.
The Sell-Off in Five Dates
Every chart below carries the same five dashed lines. Learn them once here and the charts read themselves. All times are UTC, and prices are Yahoo Finance's BTC-USD figures as of 09:27 UTC on November 14.
| Date | What happened | Bitcoin |
|---|---|---|
| Oct 29 | Binance discloses a hack affecting about $6.3 billion | Closes at $77,775, down 4.3% on the day |
| Nov 5 | The post-midterm rally to $81,080 fails as tech stocks sell off | Closes at $75,942, down 5.6% on the day |
| Nov 10 | October inflation prints 0.4% against a 0.3% forecast | Dips to $72,689, closes at $73,720 |
| Nov 12 | Nvidia says CEO Jensen Huang has resigned | Closes at $71,343 |
| Nov 13 | $70,000 breaks for the first time since August | Low of $67,653, closes at $68,249 |
From the November 4 high to the November 13 low, Bitcoin lost 16.6%. Add this morning's dip to about $66,435 and the drop is 18.1%. Against last October's record near $126,000, we're now about 47% underwater.
Chart 1: When the Selling Began
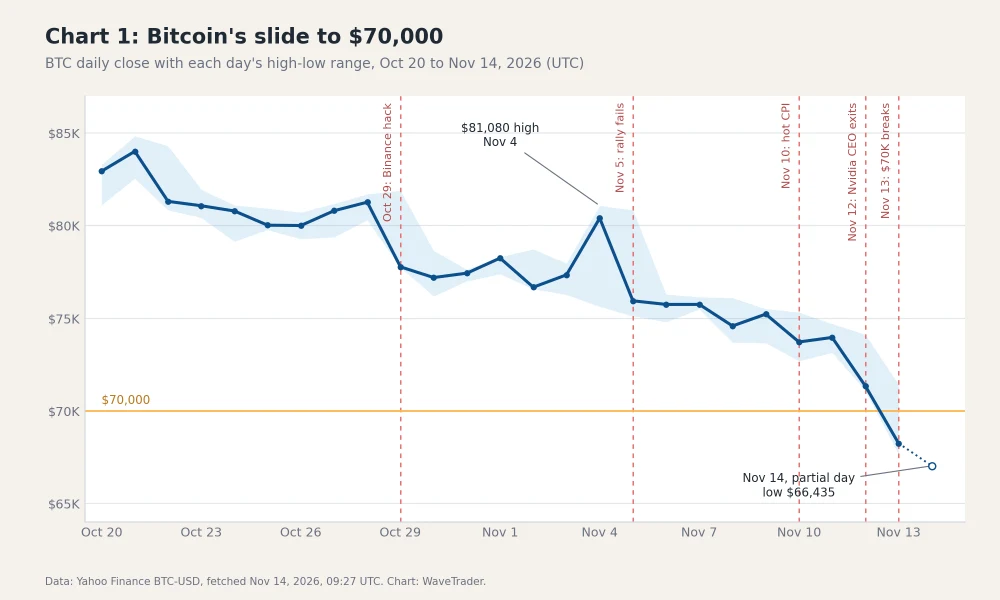 Chart: WaveTrader. Data: Yahoo Finance
I date the start of this sell-off to November 5. Here's why. On November 4, the morning after the US midterms, Bitcoin dipped to about $75,600 and then ripped to $81,080 in the same session. That looked like the Up Swell coming back. A day later the entire move was gone and Bitcoin closed at $75,942, on the heaviest volume of the whole stretch. When a market can't hold a rally that big for even 24 hours, the buyers have left the water.
The October 29 Binance hack was the first set of the swell. Bitcoin dropped 4.3% that day and never got back above $80,000 for more than a few hours. One detail matters for later. Spot ETF buyers were still putting money in that week, so the hack scared traders without chasing off the big holders.
After November 5 the chart is a staircase. The weekend of November 8 took out $75,000, with a low near $73,700. The inflation report pushed the low to $72,689. The Nvidia news took it to $71,084, and the close that day was $71,343. Each step is a lower high followed by a lower low, which is the plain definition of a Down Crash. If that pattern is new to you, our beginner's guide to market analysis walks through it slowly.
Chart 2: The Dollar Joined Late
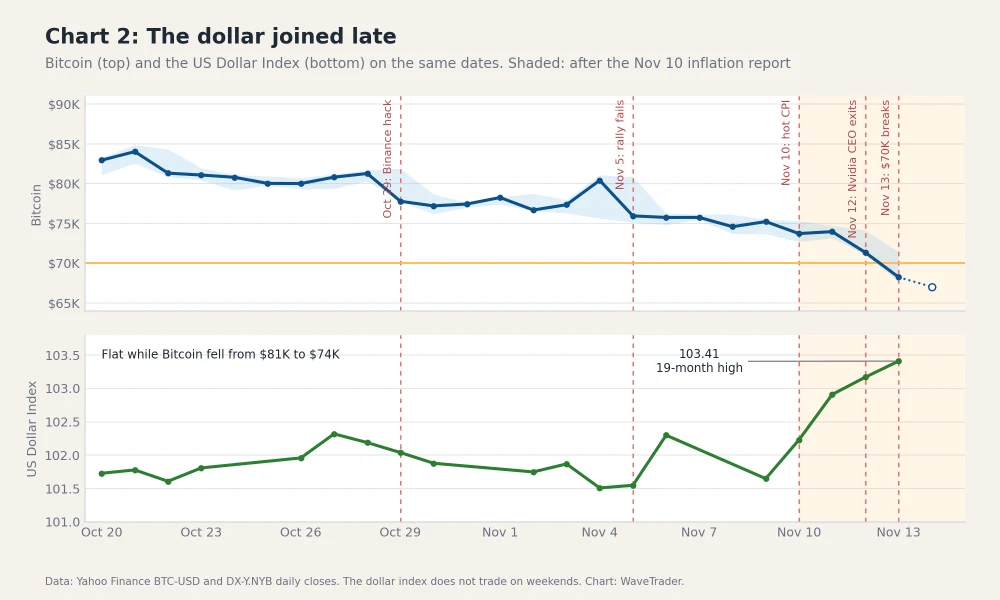 Chart: WaveTrader. Data: Yahoo Finance
Plenty of headlines this week blamed a surging dollar. The chart says that's half true. Look at the bottom panel before November 10. The Dollar Index, which tracks the dollar against six major currencies, drifts between 101.5 and 102.3. On November 4 it closed at 101.51. On November 9 it closed at 101.65. In that same window Bitcoin fell 6.4%. Whatever was sinking Bitcoin in the first week of November, it wasn't the dollar.
Then the inflation report landed. Consumer prices rose 0.4% in October when economists expected 0.3%, and core prices rose 0.3% against a 0.2% forecast. The two-year Treasury yield jumped about 20 basis points to 4.77%, its biggest one-day rise in two years. Traders pushed the odds of a quarter-point Fed hike on December 9 to nearly 89%, and gave the rest to a half-point hike.
That is when the dollar moved. From November 9 to November 13 the index climbed 1.7% to 103.41, about a 19-month high. Bitcoin fell 9.3% over those same four closes.
US Dollar Index (DXY)
A single number that tracks the US dollar against a basket of six major currencies. When it rises, dollars are in demand and money tends to leave riskier assets like crypto. Think of it as the tide. A rising dollar pulls water away from the beach, and the waves you were riding get smaller.
 Image Source: Andrew Magill, Wikimedia Commons (CC BY 2.0)
Why does a stronger dollar hurt? Bitcoin pays no interest. When short-term government debt yields close to 5% and the Fed is promising more, holding cash looks better and holding Bitcoin looks worse. The dollar and Bitcoin are both reacting to the same thing, which is the price of money going up.
Chart 3: When Forced Selling Accelerated
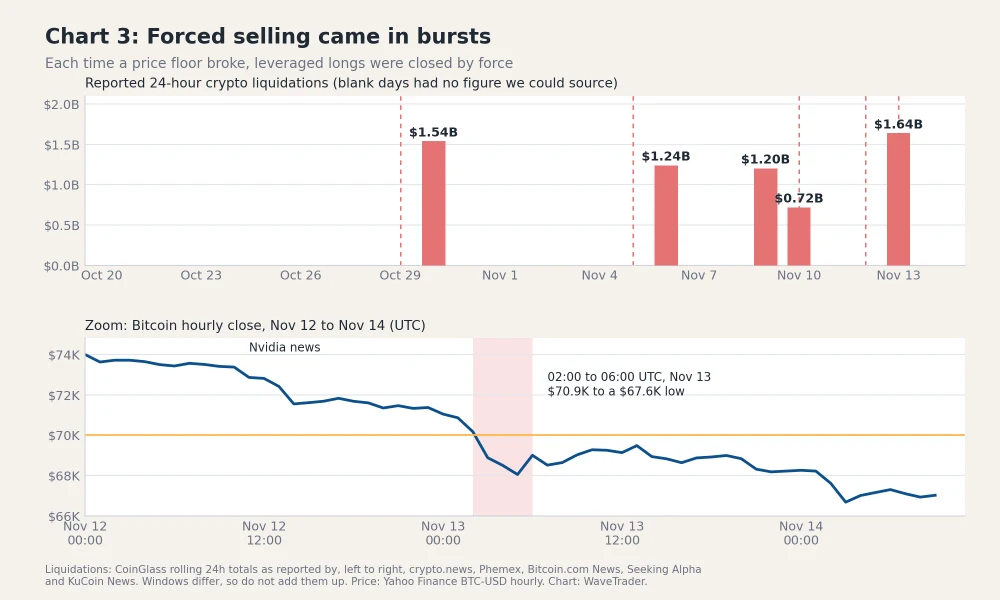 Chart: WaveTrader. Liquidation totals: CoinGlass, as reported by the outlets listed on the chart
Liquidation
When a trader borrows to make a bigger bet and the price moves against them, the exchange closes the position by force once their collateral runs out. Closing a long means selling. So a falling price triggers sales, which push the price lower, which triggers more sales. It's a wipeout that knocks the next surfer off their board too.
A caveat before the numbers. I couldn't find a free day-by-day liquidation series, so the bars are the rolling 24-hour totals that outlets quoted from CoinGlass on those days. The windows start and end at different hours, so don't add them together. Days without a bar had no figure I trusted. They weren't zero.
With that said, the pattern is clear. Forced selling arrived in bursts, and each burst lines up with a floor breaking.
- • October 29 to 30, the Binance hack. About $1.54 billion in 24 hours, and $628 million of it inside a single hour.
- • November 5 to 6, the failed rally. About $1.24 billion.
- • November 8 to 9, the weekend drop under $74,000. About $1.2 billion, with $1.04 billion of that from longs.
- • November 10, the inflation report. About $0.72 billion.
- • November 13, the $70,000 break. About $1.64 billion, with nearly 90% from longs.
Now the bottom panel, which is the answer to "when did forced selling accelerate?" Bitcoin opened the 02:00 UTC hour on November 13 at about $70,900. It crossed $70,000 inside that hour. By the 05:00 hour it had printed a low of $67,627, a 4.6% slide in under four hours. The Coin Republic, citing CoinGlass, counted $622 million liquidated in a four-hour window around the break, with $549 million of it from longs.
What explains that speed? The Nvidia news was from the day before. Iran's claim that it had destroyed a US radar in Bahrain was reported that same morning, and I can't place it to the minute against the break, so I won't pretend the order is clear. What the liquidation data does show is that $70,000 was a round number where a lot of leveraged traders had parked their bets on a bounce. Once price went through, the exchanges did the selling for them. One fair comparison, though. The single wildest hour of this whole stretch was October 29, when $628 million went in sixty minutes. The $70,000 break did less damage per hour. It got more attention because of the number.
🏄 Pro Surfer Tip
Every burst on that chart hit borrowed positions. If you own Bitcoin outright with no leverage, no exchange can close you out at 3 a.m. You can be wrong for a week and still be on your board.
So What Caused the November Bitcoin Crash?
Put the three charts together and I'd rank the causes like this.
1. The Fed is hiking again
This is the big one. The Fed raised rates in September for the first time in three years and held at 3.75% to 4.00% in late October. A strong jobs report on November 6 and the hot inflation print on November 10 made a December hike close to certain. Fed Governor Christopher Waller said that same day he'd consider a half-point move if core inflation came in at 0.3% or higher, and it did. Rising rates drain money from everything risky, and Bitcoin sits at the risky end of the beach.
2. Tech stocks stopped holding Bitcoin up
Bitcoin has traded like a tech stock for most of this year. The November 5 reversal came during a tech sell-off, and the November 12 leg came the same day Nvidia said Jensen Huang had resigned as CEO and left the board. Nvidia reports earnings on November 17 under an interim chief. That date matters for crypto more than it should.
3. ETF buyers stepped back
US spot Bitcoin ETFs lost about $1.44 billion across the five sessions through November 11, according to Farside Investors. BlackRock's fund made up most of the November 11 outflow. That's a real change from late October, when the funds kept taking in money through the Binance scare.
4. Too many borrowed bets on a bounce
Leverage set the speed of the fall. Something else started it. Each time a level broke, traders who'd borrowed to buy the dip got closed out, and that's the staircase you see in Chart 1. It's the market-wide version of the trap of revenge trading, where every loss gets answered with a bigger bet.
Two things I'd weigh lightly for now. Iran's claim on November 13 that it struck a US radar site in Bahrain added to the nerves that morning, but oil barely moved and Bitcoin was already one bad hour from $70,000. And MSCI's decision to drop Strategy from its indexes after November 30 forces index funds to sell Strategy shares, not Bitcoin. Strategy itself bought 1,036 BTC the week before.
November vs. June: How the Two Crashes Compare
If this feels familiar, it should. We covered the last one in our calm guide to the June 2026 crypto crash. Here are the two side by side, using the numbers from that post and the ones above.
| June 2026 | November 2026, so far | |
|---|---|---|
| Drop | About 22%, from above $80,000 toward $62,000 | About 18%, from $81,080 to about $66,400 |
| Speed | About a month | Ten days |
| The Fed | Holding rates, cuts priced out | Hiking, with December nearly priced in |
| Outside shock | US-Iran strikes | Binance hack, Nvidia CEO exit |
| ETF outflows | About $4.4 billion over 13 sessions | About $1.44 billion over 5 sessions |
| Strategy | Sold 32 BTC, its first sale in years | Bought 1,036 BTC, faces index removal |
| Liquidations | About $1.6 billion in the worst week, 85% longs | Up to $1.64 billion reported in 24 hours, nearly 90% longs |
Three things stand out to me. November is faster. It's also shallower, at least so far, and this morning's low is still about 9% above the June bottom near $60,800. A higher low is the first thing you want to see if the bigger trend is going to survive.
The third thing is less comfortable. In June the Fed was a spectator that had stopped cutting. Now it's raising rates, and that's a headwind that doesn't fade in a week the way a scary headline does. June's Wipeout Zone ended when the news flow calmed down. This one probably needs the rate picture to calm down, and that could take longer.
Back in July we looked at Bitcoin's 200-week moving average, the slow line that caught the June low when it sat near $61,300. It has kept rising since. One weekly-chart reading from November 12, cited by crypto.news, puts it near $68,000. That means Bitcoin is trading right at the line and slightly under it this morning. A weekly close back above it would be a good sign.
What to Watch From Here
I'm not going to call a bottom. Nobody on the beach can. But the same three charts tell you what a turn would look like.
Price. A daily close back above $70,000.
Broken floors become ceilings. Until Bitcoin closes a full day above $70,000, that level is a Wipeout Zone, and every bounce into it is suspect. The 200-week average near $68,000 is the first thing to win back. Below us, the June low near $60,800 is the line that matters most.
The dollar. A Dollar Index that stops climbing.
The index doesn't need to fall. It needs to stop making new highs above 103.4. The Fed decision on December 9 is the date to circle. A quarter-point hike is expected, so the surprise would be anything else.
Liquidations. A down day without a burst.
When Bitcoin drops 3% and liquidations stay small, the borrowed money has mostly been washed out. That's when a Paddle Zone can start to form, because the remaining sellers are choosing to sell instead of being forced to.
What should you do with your own stack in the meantime? If you're buying, buy small and on a schedule, and keep leverage at zero. Our guide to trading a correction lays out a tiered plan that would have kept you out of every burst on Chart 3. If you're only watching, that's a fine choice too. Sitting on the sand during a storm is still surfing.
In the WaveTrader app, the chart for each coin marks whether price is sitting in a Paddle Zone or a Wipeout Zone, so you don't have to work out the staircase by hand. And if you'd like a second opinion on a specific coin, you can ask Kai, our AI surf analyst, to read the current wave state and the latest Break Signals for you.
One last thought. Bitcoin fell 22% in June and people asked if crypto was dead. It then climbed about 40% off that low. I don't know if November ends the same way, and with the Fed hiking I'm more careful than I was in June. But the charts say this was a rate scare that leverage made faster. Nothing in them says Bitcoin itself broke.
This article is market commentary for education, not financial advice. Prices and liquidation totals change fast. Figures are as of 09:27 UTC on November 14, 2026.