

Quick Answer
Bitcoin and AI stocks crashed together because the same investors own both, and they sold both to raise cash. Nvidia's CEO resigned on November 12, 2026, but Nvidia was already down 27% and Bitcoin 13.5% the day before. Rising interest rates, record Bitcoin ETF outflows and forced liquidations did most of the work. The Nvidia news gave an existing sell-off a second reason to keep going.
 Image Source: Russ, Wikimedia Commons (CC BY 2.0)
Why is Bitcoin crashing in the same week as Nvidia? Bitcoin is a currency with no CEO, no earnings call and no chips to sell. Yet on Friday it lost $60,000 in the same hour the Nasdaq fell apart, and by Saturday morning it had printed $55,150, a price nobody had seen since September 2024. The easy story is that Nvidia's boss quit and everything broke. I put the dates in order to check that story, and it only half holds up.
🔑 Key Takeaways
- The slide started in October. By the close on November 11, the day before the resignation, Nvidia was down 27.4% from its record, Bitcoin 13.5% and the Nasdaq 100 9.1%.
- The resignation day was small for stocks. Nvidia closed 4.3% lower on November 12 and the Nasdaq 100 lost 0.3%. Nvidia's worst day, a 14% drop, came eight days later on a report of an SEC accounting inquiry.
- Bitcoin follows the Nasdaq down. Since October 6, the Nasdaq 100 has lost more than 1% on 12 days. Bitcoin fell on all 12.
- Bitcoin also fell with Wall Street shut. Two of its sharpest drops came on Saturdays, November 14 and November 21. Stock news alone can't explain those hours. Rates and leverage can.
- The link is shared owners. AI stocks and Bitcoin sit in the same high-risk corner of big portfolios. When rates rise and fear spikes, that corner gets sold as one block.
What Happened at Nvidia
On Thursday, November 12, Nvidia announced that co-founder Jensen Huang had resigned as president, chief executive and board member, effective immediately. He had run the company for 33 years. Chief financial officer Colette Kress became interim CEO, and director Harvey Jones became the board's first chair while it searches for a permanent replacement.
Huang later wrote that he had made "serious mistakes in my personal life" and that he is cooperating with the board's independent investigation. Press coverage, including CoinDesk's, has tied his exit to alleged relationships, one of them with a woman reportedly suspected of links to Chinese intelligence. Those allegations are untested and they aren't the subject of this post. What matters for your portfolio is the market's reaction, and it was stranger than the headlines made it sound.
Nvidia stock fell as much as 14% that morning, to $148.80. Then buyers showed up. It closed at $166.19, down 4.3% on the day. The Nasdaq 100 closed 0.3% lower. That is a bad day for one company and an ordinary day for the market.
The damage came in the days that followed. On November 17, Nvidia reported record quarterly revenue and raised its forecast, and the stock fell anyway. The same day Huang posted that he would return if the board asked. Jones answered on the earnings call, as NPR reported it, that the board had accepted the resignation unanimously and "does not intend to reinstate" him. Then on Friday, November 20, Reuters reported that SEC enforcement staff are examining potential accounting issues at the company. Reuters added the usual caution that an investigation is not evidence of wrongdoing and many close with no action. The stock dropped 14% to $125.53 anyway.
That made it Nvidia's worst week since October 2008, a 22.9% loss in five sessions. From the October 6 record close of $239.24, the stock is down 47.5%.
The Timeline: What Hit First
Here is every date that matters, in order, with what each market did that day. Stock figures are daily closes. Bitcoin days run midnight to midnight UTC. All prices are Yahoo Finance data as of 12:42 UTC on November 22.
| Date | What happened | Nvidia | Nasdaq 100 | Bitcoin |
|---|---|---|---|---|
| Oct 6 | Nvidia sets its record close | $239.24 | 31,224 | $85,558 |
| Nov 5 | Tech sells off after the US midterms and Bitcoin's rally fails | -9.3% | -6.4% | -5.6% |
| Nov 10 | October inflation comes in hot and a December rate hike looks likely | -5.5% | -0.6% | -2.0% |
| Nov 12 | Nvidia says Jensen Huang has resigned | -4.3% | -0.3% | -3.5% |
| Nov 13 | Bitcoin loses $70,000 | -2.0% | -1.2% | -4.3% |
| Nov 14 | Saturday. Bitcoin slides to $63,329 on forced selling | closed | closed | -6.0% |
| Nov 17 | Nvidia reports record revenue after the close. The board says Huang won't be back | -0.4% | -0.7% | +0.1% |
| Nov 19 | Anthropic lists on the Nasdaq. Spot Bitcoin ETFs lose $582 million | -3.3% | -2.2% | -1.7% |
| Nov 20 | Reuters reports an SEC accounting inquiry at Nvidia. Bitcoin loses $60,000 | -14.0% | -5.6% | -5.0% |
| Nov 21 | Saturday. Bitcoin hits $55,150, then climbs back above $60,000 | closed | closed | +2.2% |
Read down the Nasdaq 100 column and find the resignation. It's the smallest red number in the table. The two days that did the most damage to the whole market were November 5 and November 20. The first came a week before Huang left. The second was about Nvidia, but the news was a reported accounting inquiry, which is a different problem from an empty CEO chair. If you want the full story of the first half, including the Binance hack and the inflation report, it's in last week's post on why Bitcoin fell below $70,000. This post picks up from the resignation.
Chart 1: The Slide Started Before the CEO Left
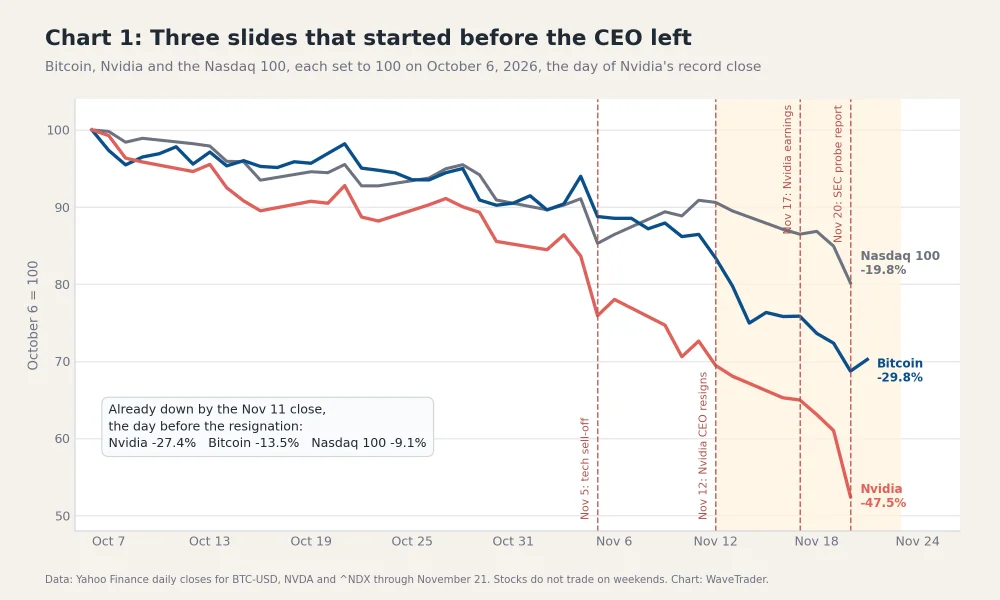 Chart: WaveTrader. Data: Yahoo Finance
This chart sets all three to 100 on October 6, the day Nvidia closed at its record. Follow the red line. By the close on November 11, one day before the announcement, Nvidia had already lost 27.4%. More than half of its total fall happened while Huang was still in the job.
Bitcoin had lost 13.5% by that same close, and the Nasdaq 100 had lost 9.1%. So when the news broke, all three were already in a Down Crash. The other half of the picture matters just as much. Measured to the November 20 close, about 57% of Bitcoin's fall and 54% of the Nasdaq 100's came after November 11. The resignation didn't start the slide, and the slide got steeper once Nvidia's troubles joined it.
What was dragging them down before November 12? Mostly the price of money. The Fed raised rates in September for the first time in three years, and the hot inflation print on November 10 made another hike on December 9 look close to certain. Add months of doubt about whether the hundreds of billions going into AI data centers will ever pay back. Reuters dates those nerves to the middle of the year and says the selling "really started to snowball" in October, once it was clear rates had further to rise.
So Nvidia's leadership shock sits in the middle of the chart. It isn't where the lines start to fall.
Chart 2: The Days the Headlines Blame
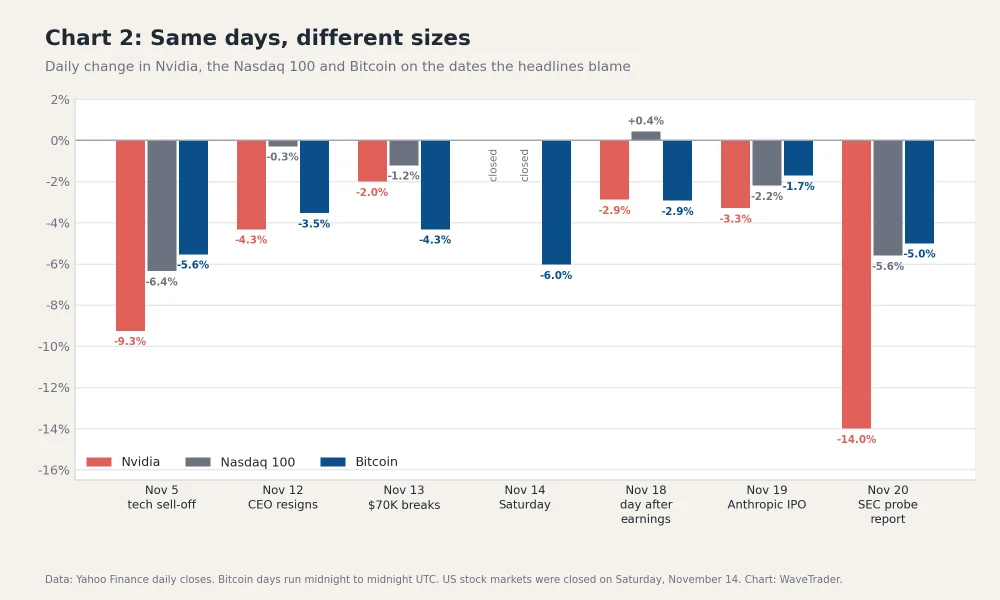 Chart: WaveTrader. Data: Yahoo Finance
Each group of bars is one day. Three things jump out.
First, November 12. Bitcoin fell 3.5% that day, more than ten times the Nasdaq 100's loss. It's tempting to pin that on Huang. But CoinDesk, watching the tape that morning, wrote that Bitcoin "showed little initial reaction" and only slid toward $71,000 after Cleveland Fed President Beth Hammack called for tighter policy. The hourly bars show Bitcoin drifting from about $74,000 to $72,800 before the announcement hour, then losing roughly another $1,300 in the two hours after it. I can't cleanly split that between Huang and Hammack. Reports that he was on his way out were already circulating that morning, and Nasdaq futures were falling before the bell. The fair reading is that both hit Bitcoin on the same day.
Second, Nvidia's earnings. The company beat expectations on November 17 and guided higher. If Bitcoin were simply tracking Nvidia's business, good numbers should have helped. Bitcoin fell 2.9% the next day. What Bitcoin tracks is the mood of the people who own both, and their mood didn't improve.
Third, November 20. This is the only day on the chart where all three bars are huge at once. The SEC report hit Nvidia. Anthropic, which had listed the day before in a record offering, was down about 10% by midday on its second day. The S&P 500 dropped 3.7% for its seventh straight loss and closed 11.6% below its October 6 close. Bitcoin went through $60,000 in the first hour of US trading.
Correlation
A number from -1 to 1 that says how closely two prices move together. At 1 they move in lockstep, at 0 they ignore each other. From October 6 to November 20, Bitcoin's daily moves had a correlation of about 0.65 with the Nasdaq 100. Picture two surfers on the same wave. They don't make identical turns, but when the wave closes out, both go down.
Here's the stat I find hardest to argue with. In the 33 trading sessions since October 6, the Nasdaq 100 lost more than 1% on 12 of them. Bitcoin was down on all 12. On the 12 days the index rose, Bitcoin rose on only 8. It has caught every Wipeout the Nasdaq threw and missed a third of the good waves.
The Bitcoin Nvidia Connection, Explained
Why should a chip company and a digital coin move together at all? There are four links, and none of them needs Bitcoin to have anything to do with artificial intelligence.
1. The same money owns both
This is the main one. A lot of crypto traders expected the opposite. The theory was that when the AI trade cooled, money would rotate into Bitcoin. It didn't. Lacie Zhang, research lead at Bitget Wallet, told CoinDesk that AI stocks and Bitcoin are "often held in the same leveraged or momentum-driven portfolios", and that when volatility jumps, institutions "reduce gross exposure and raise cash rather than rotate immediately from one high-beta trade into another."
Nicolai Søndergaard of Nansen put it more bluntly in the same outlet. "AI and crypto draw on the same pool of risk capital, so when Nvidia sells off the money goes to cash, not into bitcoin."
Think of a fund manager's portfolio as a quiver of boards. The safe longboards are bonds and cash. The twitchy shortboards are AI stocks and crypto. When the forecast turns ugly, the shortboards all go back in the van together. Nobody swaps one for another.
2. Rates hit both the same way
Bitcoin pays no interest. Most AI companies promise profits that are years away. Both look worse when a ten-year Treasury pays above 5%, which it did in the week of November 12. The Fed's rate sits at 3.75% to 4.00%, and Cointelegraph reported that Polymarket traders put the odds of another hike by December 9 at 94%. That is one tide pulling on two boats.
You can see where the money went. Last week Treasury bonds rallied, and as of Friday the ten-year yield was on track for its biggest weekly fall since April 2025, according to Reuters. Gold, the classic safe harbor, fell to its lowest since September 2025. When even gold gets sold, investors aren't picking a different asset. They want cash.
3. The ETF door swings both ways
Spot Bitcoin ETFs made it easy for stock investors to buy Bitcoin from a brokerage account. They also made it easy to sell, in the same app, in the same panic. On November 19 the funds lost $582.3 million in one day. BlackRock's fund accounted for $541.1 million of that, its largest single-day outflow on record, according to Farside Investors. By crypto.news's count, about $3.5 billion left in November through that date. Back in the spring we wrote about what ETFs mean for traders when the money was flowing in. This is the same pipe running backwards.
4. Bitcoin miners became AI landlords
Over the past year, miners such as IREN and Cipher have rented their power and floor space to the companies that buy Nvidia's chips. That gives them two ways to get hurt. A lower Bitcoin price cuts mining revenue, and a colder AI market cuts the value of the new business. CoinDesk reported those stocks down 5% to 10% on the day of the resignation. On November 20 its tickers showed both down about 17%.
Risk-off
Trader shorthand for a stretch when investors sell whatever might fall further and hold cash or government bonds. In a risk-off week, what an asset does matters less than who owns it and how fast they need out. It's the lifeguard raising the red flag. Everyone leaves the water, good surfers included.
Chart 3: What Nvidia Can't Explain
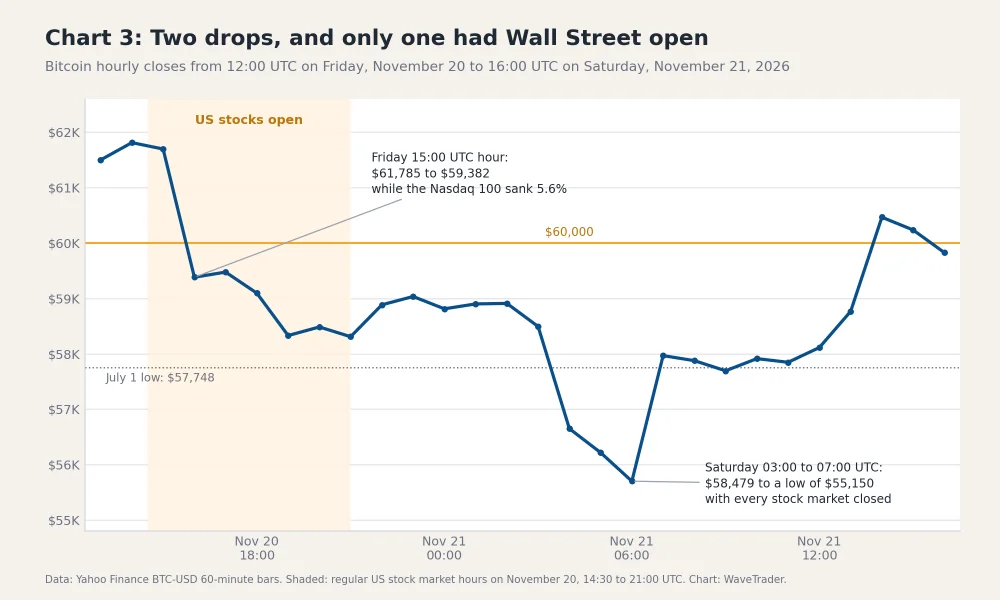 Chart: WaveTrader. Data: Yahoo Finance
If shared owners were the whole story, Bitcoin would only fall when Wall Street is open. This chart shows two drops about twelve hours apart.
The first is the stock market's. In the 15:00 UTC hour on Friday, right after the US open, Bitcoin went from $61,785 to $59,382. That's a 3.9% fall in sixty minutes while the Nasdaq 100 was on its way to a 5.6% loss. Bitcoin kept sinking through the session and bottomed near $57,700, about $40 under the July 1 low of $57,748.
The second drop belongs to crypto alone. Between 03:00 and 07:00 UTC on Saturday, with every stock exchange closed, Bitcoin fell from $58,479 to $55,150. No stock was trading in those hours. CoinDesk's report that morning pointed to rising inflation-adjusted Treasury yields and a hawkish Fed, and cited CoinGlass data showing $2.4 billion in crypto futures bets liquidated in 24 hours, more than $1 billion of it in Bitcoin. The summer low had just been pierced, and forced selling took price the rest of the way.
The Saturday before went the same way. On November 14, Bitcoin fell 6% with stocks shut, and by Sunday rolling 24-hour liquidations had briefly passed $2 billion, according to CoinGlass data cited by CoinDesk. So two of Bitcoin's sharpest drops this month came on Saturdays, with Wall Street closed for both.
Put the two mechanisms together and you get this month's pattern. On weekdays the Nasdaq breaks one of Bitcoin's floors. On the weekend, when trading is thin, liquidations do the rest. Last week I called the summer low the line that mattered most. Price went through it on Friday and again on Saturday, and I'd be lying if I said that didn't change my read.
🏄 Pro Surfer Tip
When a headline names one cause, check it against a day the cause couldn't have acted. A weekend is the easiest test. If Bitcoin fell hard on a Saturday, the answer includes something inside crypto, and that something is usually leverage.
What to Watch From Here
As I write this on Sunday, Bitcoin is near $60,600, about 52% below last October's record near $126,000. It bounced about 10% off Saturday's low, which tells you buyers exist down here. It doesn't tell you the selling is done. Wintermute's trading desk warned a week ago that a liquidation flush is not the same as a bottom, because short sellers closing out can lift price without one new buyer showing up.
James Butterfill, head of research at CoinShares, called the dip below $60,000 "uncomfortable rather than thesis-changing" and still expects a $60,000 to $90,000 range until rates or liquidity shift. That's one informed view. Here's what I'd watch to test it.
Monday's stock open and ETF flows.
Bitcoin reclaimed $60,000 while stocks were closed. The real test is whether it holds when the Nasdaq opens on November 23. Friday's ETF flow figure comes out the same day. Another outflow near $500 million would say the exit isn't finished.
The Fed on December 9.
Rates started this, so rates probably have to end it. A hike is priced in. Analysts at Citi, quoted by Reuters, said the market could start pricing hikes out if the stock sell-off turns into a full AI bust. That would be bad news for stocks arriving as good news for Bitcoin, which is a strange thing to root for.
Nvidia's next two answers.
Who gets the permanent CEO job, and what comes of the reported SEC inquiry. Neither has a date. Until both are settled, any Nvidia headline can knock the Nasdaq around, and Bitcoin has gone down with it 12 times out of 12.
Three Bitcoin levels.
$60,000 is the round number everyone is staring at. $57,748 is the summer low. Price dipped under it on Friday and Saturday but closed both days back above it, so the level is damaged and still standing. $55,150 is Saturday's low. A daily close under that puts Bitcoin at prices last seen in September 2024. On the way up, the 200-week moving average near $68,000 is the first ceiling that matters.
And what about your own stack? If you hold Bitcoin with no borrowed money, nothing in this post can force you to sell. Every Saturday wipeout this month hit leveraged positions first. If you're buying, small and on a schedule beats trying to catch the exact bottom, and our guide to trading a correction lays out a tiered plan for that. If you're tempted to win it all back with one big trade, read about market cycle psychology first. Fear at 12 out of 100 on the Fear and Greed Index is when people make their worst decisions.
In the WaveTrader app, each coin's chart marks whether price is in a Paddle Zone or a Wipeout Zone and flags new Break Signals as they form, so you can see a broken floor without drawing the lines yourself. And if you'd like a second read on a specific coin before Monday's open, ask Kai, our AI surf analyst, for the current wave state and the latest news around it.
One last thought. The question people keep asking is whether Nvidia crashed Bitcoin. The dates say not alone. Bitcoin and AI stocks were on the same wave before Jensen Huang resigned, because the same investors were riding both with borrowed money while the Fed pulled the tide out. That link won't go away when Nvidia names a new CEO. The next time the Nasdaq has a 5% day, check your Bitcoin, because the odds are good it'll be red too.
This article is market commentary for education, not financial advice. Prices change fast. Figures are Yahoo Finance data as of 12:42 UTC on November 22, 2026, and reported claims about Nvidia are attributed to the outlets named.